Bio-Analytical SPE Method: Fidaxomicin
Quantitative Estimation from Human K2 EDTA Plasma Samples
FIDAXOMICIN
LC/MS method for quantitative Estimation of Fidaxomicin, and it's metabolite OP-1118 from Human K2 EDTA plasma samples.
LC/MS-MS Assay method was developed and validated for estimation of plasma levels of Fidaxomicin and it's metabolite OP-1118 with LLOQ of 50 pg/ml and 0.2 ng/ml respectively. Method is successfully applied for performing sample analysis of Bioequivalence studies of Fidaxomicin 200 mg tablets.
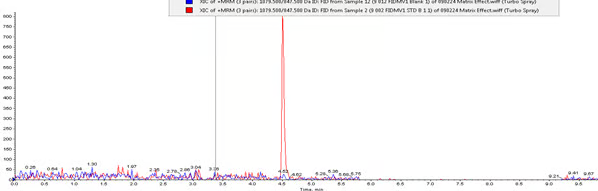
Chromatogram 1: Fidaxomicin LLOQ (50 pg/ml) overlay on Blank Plasma Sample
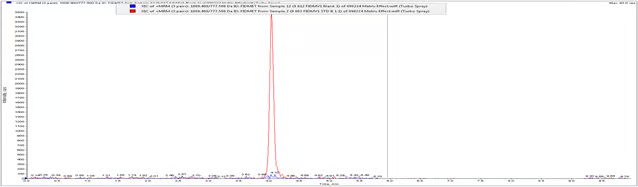
Chromatogram 2: OP-1118 LLOQ (0.2 ng/ml) overlay on Blank Plasma sample
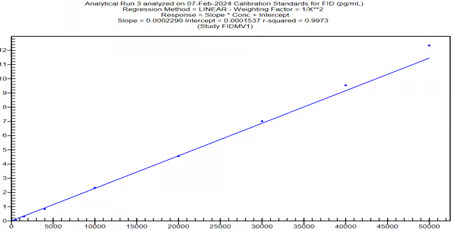
Graph-1, Calibration curve, Fidaxomicin
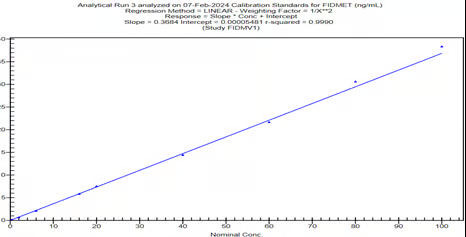
Graph-2, Calibration curve, OP-1118
Results Summary
Fidaxomicin
| Experiments | Results |
|---|---|
| S/N | >20:1 for LLOQ, 50 pg/ml |
| Selectivity | Interference <20% of LLOQ in Normal, haemolytic and lipemic plasma |
| Recovery | 76, 78 and 82% at LQC, MQC and HQC levels |
| Precision | 4.3 to 6.1% for LLOQ, LQC, MQC and HQC levels |
| Accuracy | -0.3 to -6.4% for LLOQ, LQC, MQC and HQC levels |
| Stability | All matrix stabilities are within specifications |
| Long term stability | Samples are stable at -20c for 75 days |
OP-1118
| Experiments | Results |
|---|---|
| S/N | >20:1 for LLOQ 0.2 ng/ml |
| Selectivity | Interference <20% of LLOQ in Normal, haemolytic and lipemic plasma |
| Recovery | 75, 78 and 80% at LQC, MQC and HQC levels |
| Precision | 2.6 to 5.1% for LLOQ, LQC, MQC and HQC levels |
| Accuracy | -0.8 to -2.0% for LLOQ, LQC, MQC and HQC levels |
| Stability | All matrix stabilities are within specifications |
| Long term stability | Samples are stable at -20c for 75 days |